 dailynewsnblog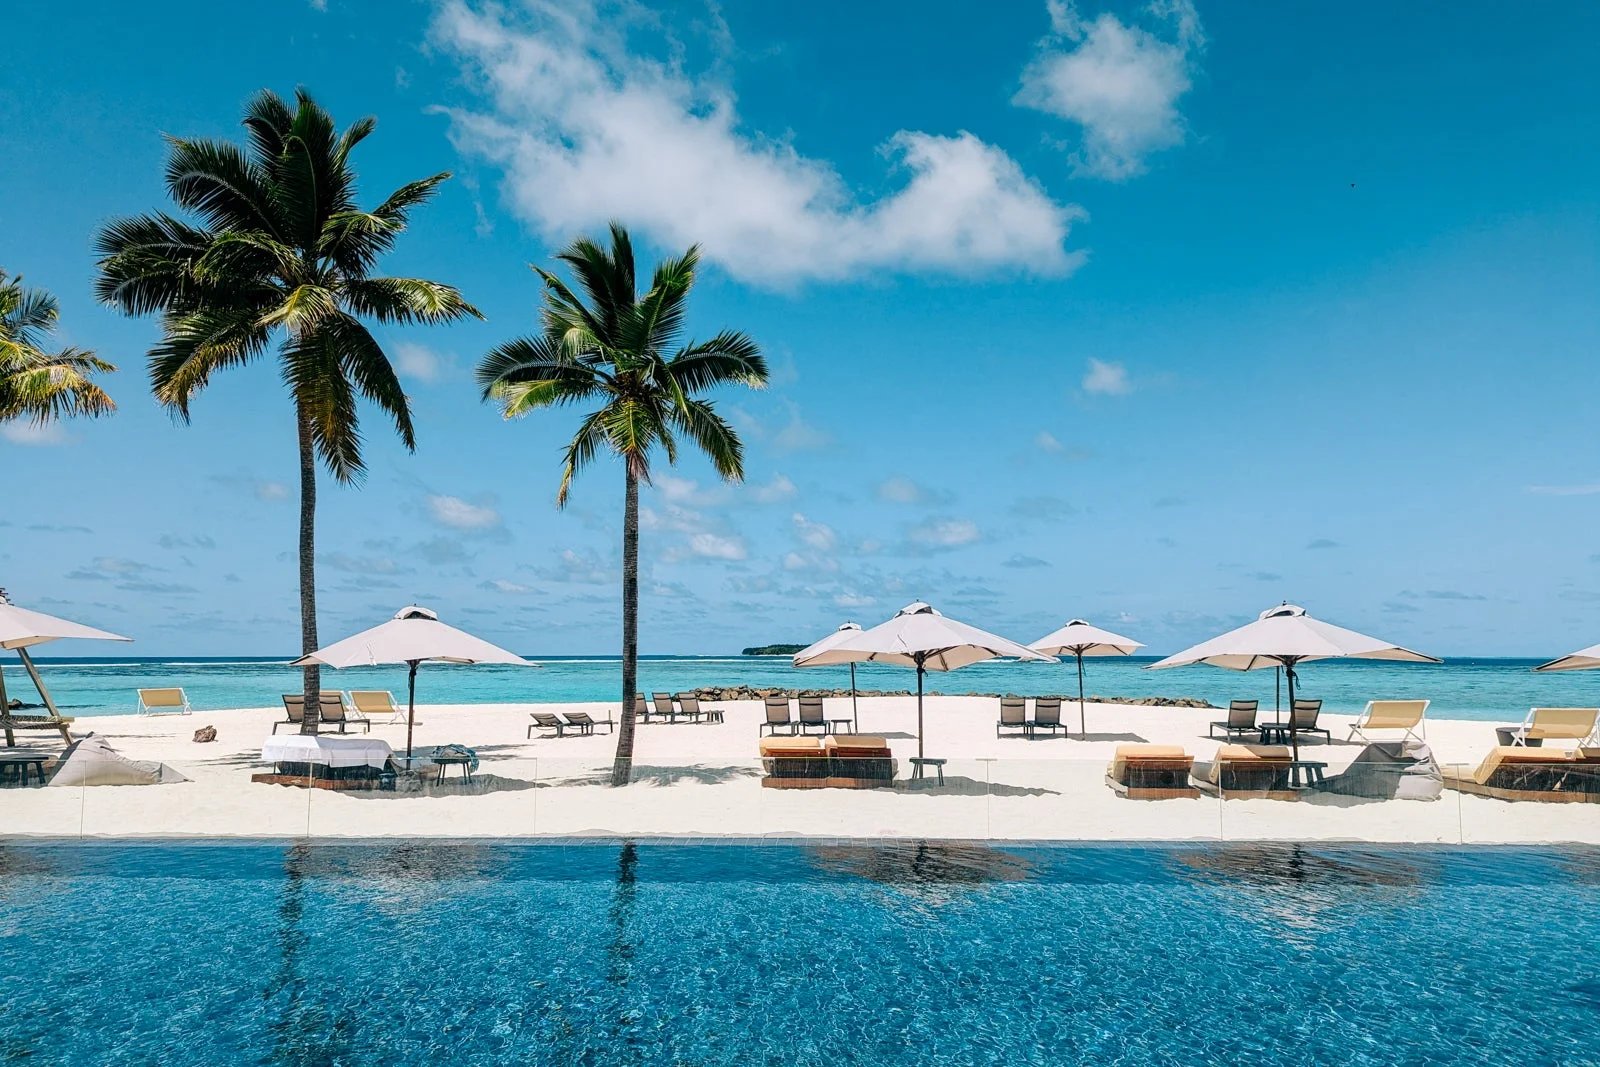
Ahead of the May 20 World of Hyatt award chart changes — which included a switch from three pricing tiers per category to five and 136 properties changing categories — many loyalists feared the program would lose much of its value.
Luckily, the changes haven’t been as bad as many feared. TPG’s Nick Ewen wrote about his first impressions of the Hyatt award chart changes on May 20. Two days later, we used data from Gondola (a free hotel search and direct booking platform for frequent travelers) to discuss how award pricing changed at 19 popular Hyatt properties.
Now, we’re back with more data from Gondola — this time across 1,078 properties, including every property that changed categories May 20 and a broad sample of other properties. This data shows that while some redemptions became dramatically more expensive, many Hyatt sweet spots survived, and some properties even became cheaper on points.
Effect of the Hyatt award chart changes by category
I frequently redeem points at low-category Hyatt properties, such as Hyatt Category 1 hotels. So, although our previous stories focused on high-category and aspirational properties, I was eager to see how award pricing and redemption rates changed on a category-by-category basis.
The chart below includes data across 1,018 properties with standard room rewards that price according to the Hyatt award chart for hotels and resorts (i.e., all Hyatt options excluding Miraval, all-inclusive collection and dynamically priced properties). Properties that changed categories on May 20 are listed under their pre-May 20 category.
| Previous category | Properties | Previous average award rate (in points) | New average award rate (in points) | Change in average award rate | Previous average redemption rate (cents per point) | New average redemption rate (cents per point) | Change in average redemption rate (cents per point) |
|---|---|---|---|---|---|---|---|
|
203 |
5,331 |
5,704 |
Up 7% |
2.43 |
2.32 |
Down 0.11 |
|
|
268 |
8,269 |
8,782 |
Up 6% |
2.14 |
2.05 |
Down 0.09 |
|
|
215 |
12,393 |
12,684 |
Up 2% |
1.93 |
1.88 |
Down 0.05 |
|
|
119 |
15,489 |
17,088 |
Up 10% |
2.02 |
1.84 |
Down 0.18 |
|
|
101 |
20,203 |
20,826 |
Up 3% |
1.73 |
1.67 |
Down 0.06 |
|
|
51 |
25,380 |
26,377 |
Up 4% |
1.86 |
1.81 |
Down 0.05 |
|
|
40 |
30,410 |
33,458 |
Up 10% |
2.13 |
2.03 |
Down 0.1 |
|
|
21 |
43,616 |
48,951 |
Up 12% |
2.14 |
1.86 |
Down 0.28 |
Importantly, these averages reflect both Hyatt’s new five-tier pricing structure and the annual category adjustments.
The median-night data tells a much more encouraging story for most travelers. Because Hyatt added more lower-priced tiers alongside the new Upper and Top tiers, travelers with flexible dates may see little change — or even lower award pricing — on many stays.
| Previous category | Properties | Previous median award rate (in points) | New median award rate (in points) | Change in median award rate | Previous median redemption rate (cents per point) | New median redemption rate (cents per point) | Change in median redemption rate (cents per point) |
|---|---|---|---|---|---|---|---|
|
203 |
5,000 |
4,500 |
Down 10% |
2.25 |
2.23 |
Down 0.02 |
|
|
268 |
8,000 |
7,500 |
Down 6% |
1.95 |
1.91 |
Down 0.04 |
|
|
215 |
12,000 |
12,000 |
0% |
1.72 |
1.74 |
Up 0.02 |
|
|
119 |
15,000 |
15,000 |
0% |
1.81 |
1.68 |
Down 0.13 |
|
|
101 |
20,000 |
20,000 |
0% |
1.59 |
1.58 |
Down 0.01 |
|
|
51 |
25,000 |
25,000 |
0% |
1.71 |
1.67 |
Down 0.04 |
|
|
40 |
30,000 |
30,000 |
0% |
1.94 |
1.87 |
Down 0.07 |
|
|
21 |
40,000 |
45,000 |
Up 13% |
1.57 |
1.48 |
Down 0.09 |
Even so, it’s obvious that the properties in categories 4 and 8 before May 20 are the ones that fared, on average and by median, worst. It’s interesting that low category (categories 1 and 2) and Category 7 properties had and kept the best redemption rates based on average and median.
Related: How to transfer Chase points to Hyatt: A step-by-step guide

Reward your inbox with the TPG Daily newsletter
Join over 700,000 readers for breaking news, in-depth guides and exclusive deals from TPG’s experts
Effect of the annual Hyatt category changes
On May 20, 136 properties also changed categories. Of the ones that follow Hyatt’s standard award chart (so excluding Miraval, all-inclusive collection and dynamically priced properties), 108 moved up in category and 21 moved down.
By sheer point cost, the worst category changes were to high-category properties. Here’s a look at some of the worst increases on an average points per night basis:
| Property | New category | Previous average award rate (in points) | New average award rate (in points) | Change in average award rate (in points) |
|---|---|---|---|---|
|
Hyatt Regency Aruba Resort Spa and Casino
|
8 |
36,892 |
53,333 |
Up 16,442 |
|
8 |
40,342 |
55,000 |
Up 14,658 |
|
|
Hotel Fluela Davos in Switzerland
|
8 |
32,869 |
45,000 |
Up 12,131 |
|
Hyatt House Tokyo Shibuya
|
6 |
21,293 |
31,667 |
Up 10,374 |
|
Andaz 5th Avenue in New York
|
8 |
32,255 |
42,273 |
Up 10,018 |
|
Hyatt Regency Lisbon in Portugal
|
5 |
17,049 |
25,250 |
Up 8,201 |
|
5 |
15,526 |
22,909 |
Up 7,383 |
|
|
8 |
41,156 |
48,333 |
Up 7,177 |
|
|
7 |
27,512 |
34,222 |
Up 6,710 |
However, the largest percentage changes were at low-category properties. Here’s a look at some of the worst changes on a percentage basis:
| Property | New category | Previous average award rate (in points) | New average award rate (in points) | Percentage change in average award rate |
|---|---|---|---|---|
|
Hyatt Regency Kuantan Resort in Malaysia
|
2 |
4,926 |
8,375 |
Up 70% |
|
Hyatt Place Sumter / Downtown in South Carolina
|
2 |
5,667 |
9,545 |
Up 68% |
|
Hyatt Place Kyoto in Japan
|
3 |
8,713 |
14,600 |
Up 68% |
|
Hyatt House Monterrey Valle / San Pedro in Mexico
|
2 |
5,026 |
8,333 |
Up 66% |
|
Hyatt Place Mount Laurel in New Jersey
|
2 |
5,187 |
8,500 |
Up 64% |
|
Hyatt Place Rouen in France
|
2 |
5,118 |
8,375 |
Up 64% |
|
Hyatt Regency Columbus in Ohio
|
3 |
8,142 |
13,200 |
Up 62% |
|
Hyatt Place Dubai Jumeirah
|
2 |
4,908 |
7,955 |
Up 62% |
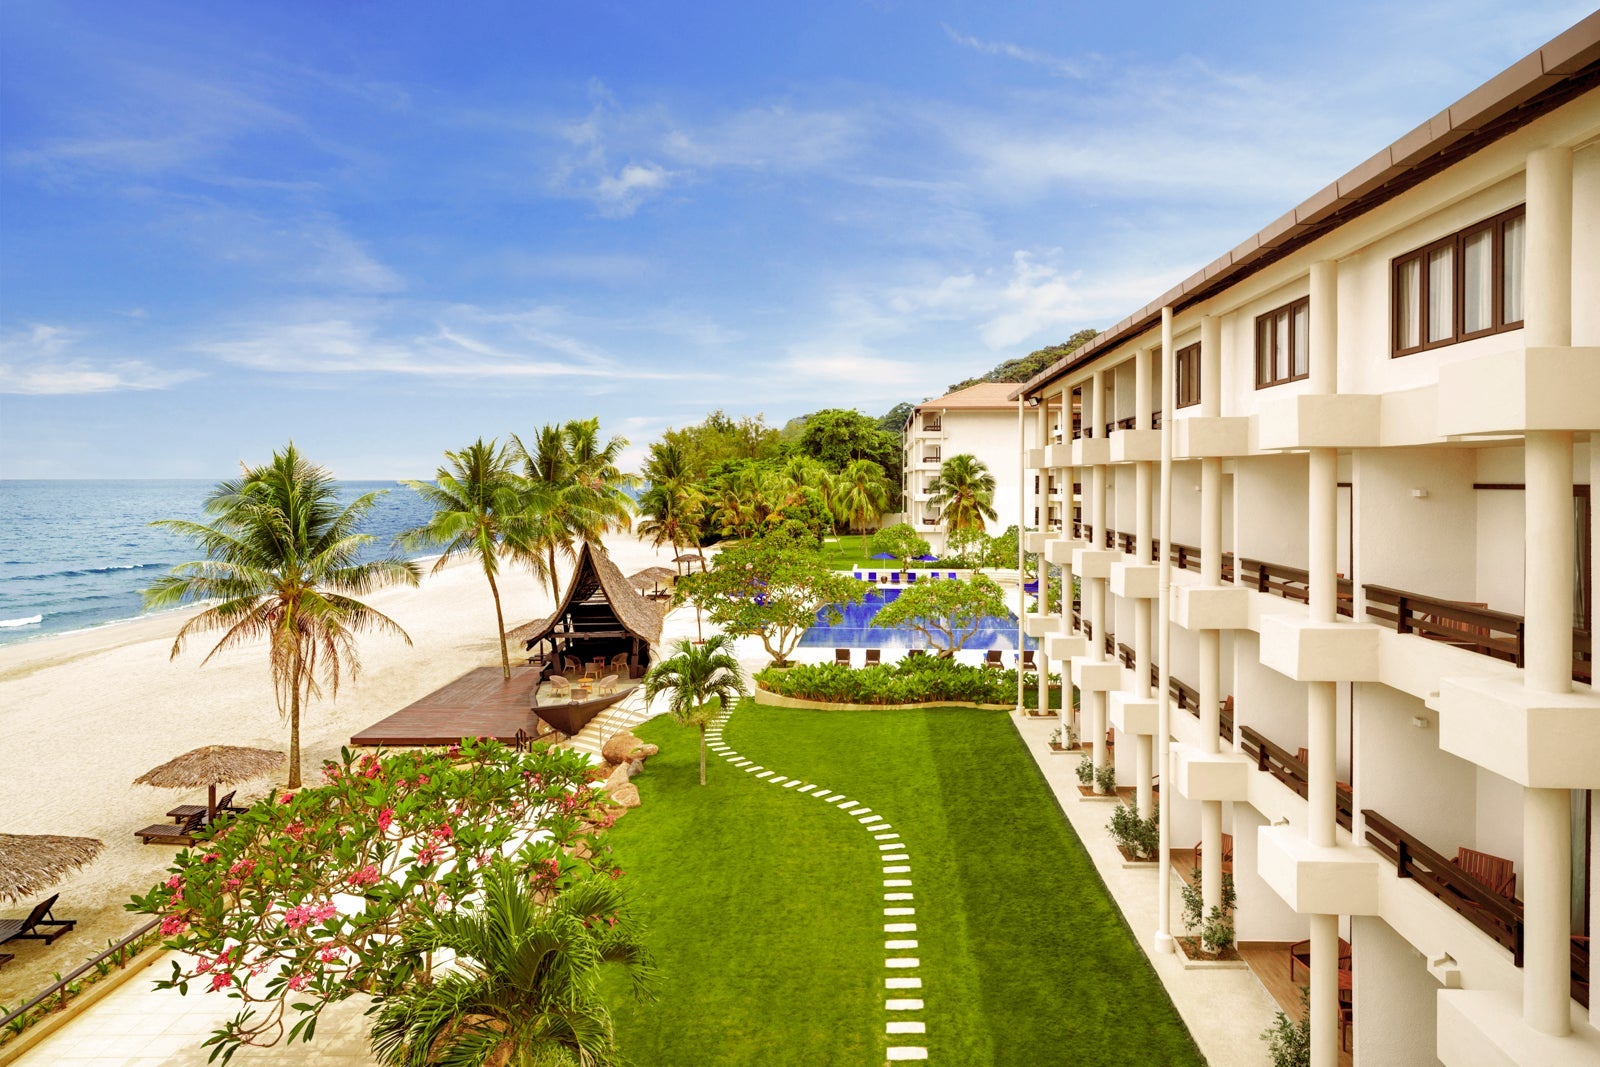
I’ve stayed at the Hyatt Regency Kuantan Resort twice, and I love the property. But with this massive increase in the average award rate, I’ll likely book at a paid rate instead of redeeming Hyatt points for my next stay. After all, paid rates are still low at this property on many dates.
However, it’s not all bad news. Twenty-one properties that use the standard Hyatt award chart dropped in category. And, as you can see in the following chart, the points and percentage decreases are massive for some of these properties.
| Property | New category | Previous average award rate (in points) | New average award rate (in points) | Change in average award rate (in points) | Percentage change in average award rate |
|---|---|---|---|---|---|
|
4 |
19,503 |
14,000 |
Down 5,503 |
Down 28% |
|
|
Hyatt Centric Delfina Santa Monica in California
|
5 |
25,776 |
21,111 |
Down 4,665 |
Down 18% |
|
4 |
20,321 |
15,833 |
Down 4,488 |
Down 22% |
|
|
Andaz West Hollywood in California
|
5 |
26,194 |
21,818 |
Down 4,376 |
Down 17% |
|
Hyatt Centric Congress Avenue Austin
|
4 |
20,118 |
15,833 |
Down 4,285 |
Down 21% |
|
Commune by the Great Wall in China
|
2 |
11,909 |
7,750 |
Down 4,159 |
Down 35% |
|
Hyatt Place London City East
|
3 |
15,010 |
11,000 |
Down 4,010 |
Down 27% |
|
Hyatt Place Santa Barbara in California
|
5 |
25,515 |
21,667 |
Down 3,849 |
Down 15% |
The category decrease for the Hyatt Centric Congress Avenue Austin, Andaz Macau and The Standard, Singapore is particularly exciting, as now you can redeem Category 1-4 certificates at these properties.
Related: The best Hyatt Category 4 hotels to maximize your free night award certificates
Hyatt award chart changes left sweet spots
One of the biggest fears of many Hyatt loyalists was that the Hyatt award chart changes would kill most sweet spots. But, among 50 of the highest cents per point properties in pre-May 20 data that didn’t change category on May 20, the typical (median) night moved 0 points and the average nightly rate increased just 209 points from 11,913 to 12,122 points.
Interestingly, the average cents-per-point across these 50 properties increased slightly (from 2.68 to 2.75) because the paid rates also increased slightly.
If we zoom out to the larger 1,078-property sample, 163 properties still offer an average redemption rate of 2.5 cents per point or higher. Here are a few notable examples:
| Property | Current category | Previous average award rate (in points) | Current average award rate (in points) | Previous average redemption rate (cents per point) | Current average redemption rate (cents per point) |
|---|---|---|---|---|---|
|
Hyatt House Nairobi Westlands in Kenya
|
1 |
5,604 |
5,455 |
4.17 |
4.76 |
|
Hyatt Regency Rochester in New York
|
1 |
5,089 |
4,625 |
3.82 |
4.43 |
|
Hyatt Regency Merida in Mexico
|
1 |
5,159 |
4,875 |
3.50 |
4.04 |
|
Park Hyatt St. Kitts Christophe Harbour
|
7 |
28,664 |
30,333 |
3.60 |
3.82 |
|
8 |
41,856 |
46,000 |
4.42 |
3.73 |
|
|
8 |
40,342 |
55,000 |
4.62 |
3.71 |
|
|
Park Hyatt Maldives Hadahaa
|
7 |
30,595 |
27,857 |
4.12 |
3.68 |
It’s impressive to see that the average award rate not only went down at Category 1 properties like the Hyatt Regency Rochester and the Hyatt Regency Merida, but also at an aspirational property like the Park Hyatt Maldives Hadahaa. I absolutely loved my stay at the Park Hyatt Maldives and will be looking to return on Lowest or Low dates.
Related: 22 best Hyatt hotels in the world to book with points
Bottom line
The May 20 Hyatt award chart changes certainly affected all property tiers, but the impact was uneven. Although average nightly award rates increased in every category, the effect ranged from a modest 2% increase in Category 3 to a 12% increase in Category 8. Some properties — primarily those that changed category or occupy higher categories — did see significant increases in their average award rates. But some specific properties, including several in Category 1 and at least one in Category 7, saw decreases in their average award rates.
I, frankly, never expected to see the average award cost of the Park Hyatt Maldives Hadahaa decrease in this set of Hyatt award chart changes. But, when you think about it, the Maldives has serious peak and off-peak seasons, and resorts often have low occupancy on some off-peak dates. So, in the case of the Park Hyatt Maldives, we’re likely seeing those dates gain the Lowest award pricing tier for Category 7, while other nights keep approximately the same rates as before.
In short, this set of Hyatt award chart changes will sting for travelers who can only travel on peak dates and hence will need to redeem at the Upper and Top award tiers. However, in general, most travelers will still be able to find high-value ways to redeem Hyatt points.
Hyatt redemptions now require more strategy than before. But for travelers with flexible dates, World of Hyatt remains one of the most valuable hotel loyalty programs.
Gondola is a free hotel search and direct booking platform for frequent travelers, making it easy to compare cash and points rates across brands while earning up to an extra 7% cash back.