Why Some US Indian Reservations Prosper While Others Struggle


Our colleague Thomas Stratmann writes about the political economy of Indian reservations in his excellent Substack Rules and Results.

Across 123 tribal nations in the lower 48 states, median household income for Native American residents ranges from roughly $20,000 to over $130,000—a sixfold difference. Some reservations have household incomes comparable to middle-class America. Others face persistent poverty.

Why?

The common assumption: casino revenue. The data show otherwise. Gaming, natural resources, and location explain some variation. But they don’t explain most of it. What does? Institutional quality.

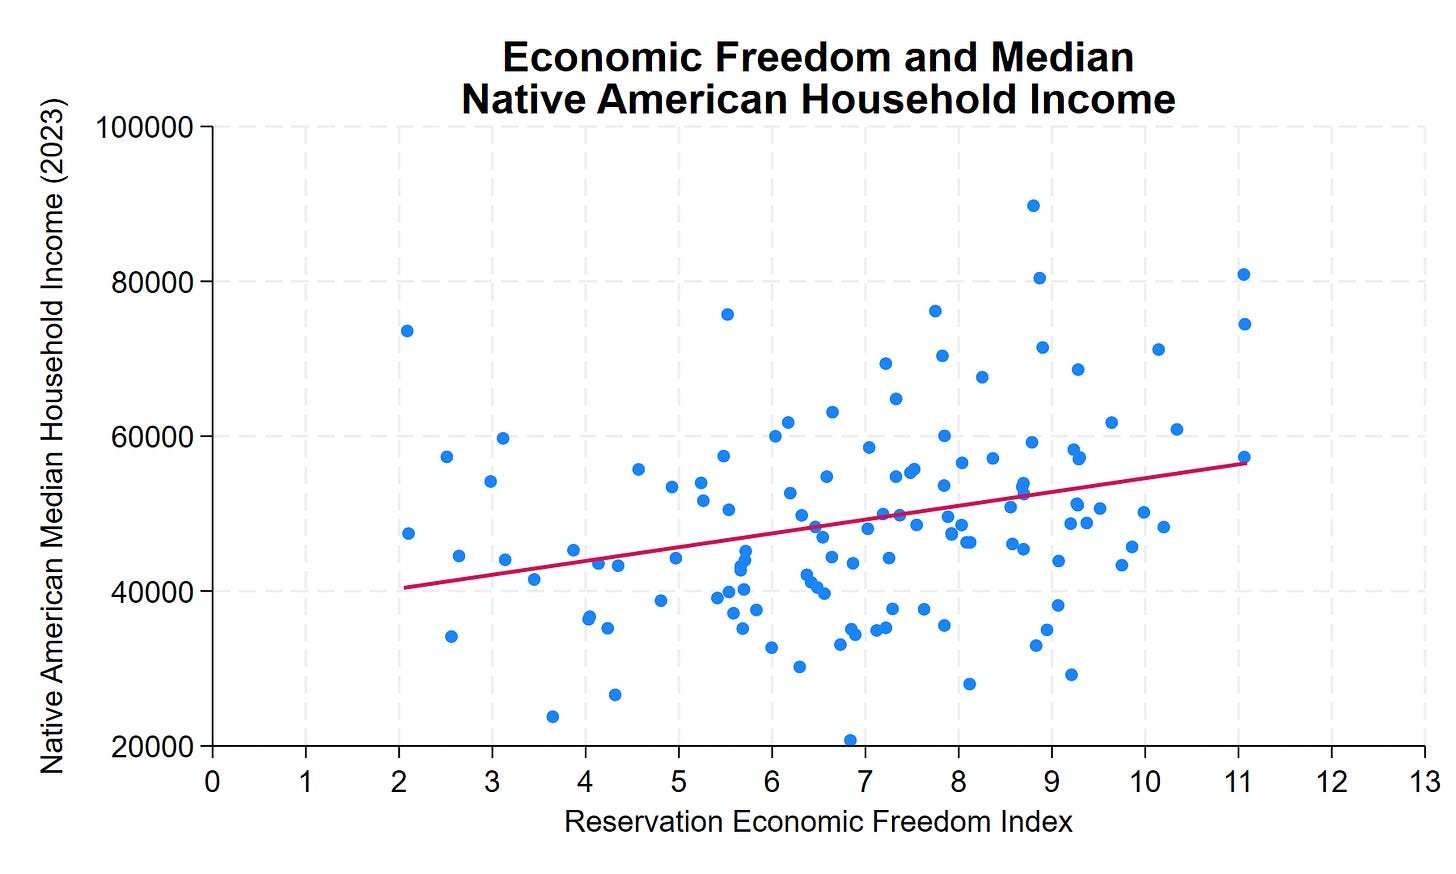
The Reservation Economic Freedom Index 2.0 measures how property rights, regulatory clarity, governance, and economic freedom vary across tribal nations. The correlation with prosperity is clear, consistent, and statistically significant. A 1-point improvement in REFI—on a 0-to-13 scale—correlates with approximately $1,800 higher median household income. A 10-point improvement? Nearly $18,000 more per household.
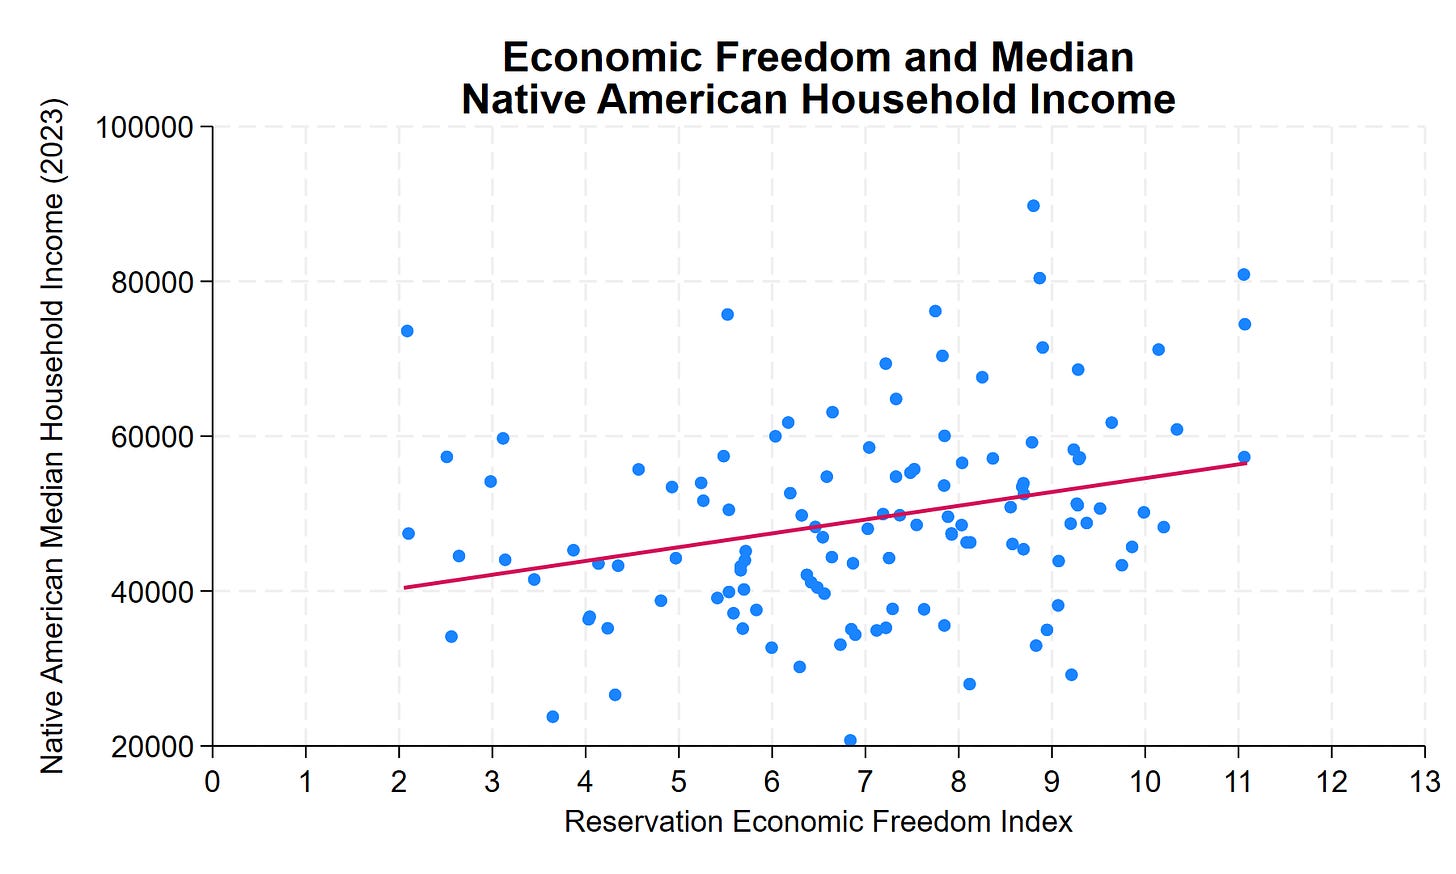
Scatter plot showing positive correlation between Reservation Economic Freedom Index scores (0-13 scale) and median Native American household income. Each blue dot represents one reservation. Red trend line shows approximately $1,783 higher income per REFI point. Chart shows 120 reservations after excluding 3 outliers. Income ranges from $20,000 to $100,000.

Many low-REFI features aren’t tribal choices—they’re federal impositions. Trust status prevents land from being used as collateral. Overlapping federal-state-tribal jurisdiction creates regulatory uncertainty. BIA approval requirements add months or years to routine transactions. Complex jurisdictional frameworks can deter investment when the rules governing business activity, dispute resolution, and enforcement remain unclear.

This is an important research program. In addition to potentially improving the lives of native Americans, the 123 tribal nations are a new and interesting dataset to study institutions.

See the post for more details amd discussion of causality. A longer paper is here.


Source link

  • Related Posts

    Supreme Court rejects Michigan cop’s bid to toss out an excessive force claim from a George Floyd protest

    WASHINGTON — The Supreme Court on Tuesday rejected a Michigan police officer’s attempt to evade an excessive force claim arising from an incident that took place during a protest in…

    B.C. minimum wage increase adds pressure on small businesses

    B.C. employers ‘caught in between’ rising taxes and payroll costs, business group says Source link

    Leave a Reply

    Your email address will not be published. Required fields are marked *

    You Missed

    Supreme Court rejects Michigan cop’s bid to toss out an excessive force claim from a George Floyd protest

    Supreme Court rejects Michigan cop’s bid to toss out an excessive force claim from a George Floyd protest

    Show Your Colors with XBOX Design Lab – Introducing the Team Spirit Limited Edition Controller

    Show Your Colors with XBOX Design Lab – Introducing the Team Spirit Limited Edition Controller

    The double standard of outrage over treatment of flotilla activists

    Meet WordCamp Agent: A Preview of the WordPress Memory Layer – WordPress.com News

    Meet WordCamp Agent: A Preview of the WordPress Memory Layer – WordPress.com News

    Royal Challengers Bengaluru v Gujarat Titans – Cricket

    Royal Challengers Bengaluru v Gujarat Titans – Cricket

    A Guide to Wearing Colour in 2026

    A Guide to Wearing Colour in 2026