 dailynewsnblog
What are the local economic consequences of Ukrainian long-range strikes on Russian oil refineries? Russian authorities often downplay or deny damage to strategic infrastructure, while reliable local economic data are unavailable, delayed, or difficult to verify. More generally, official measures of economic performance in authoritarian regimes can diverge systematically from economic activity measured by nighttime lights (Martínez 2022).
Assessing the impact of deep strikes is part of a broader policy debate over how economic pressure affects Russia’s capacity to sustain the war. Recent VoxEU contributions have examined sanctions, oil revenues, payment channels, and the mechanisms through which Russia adapts to external pressure (Cocozza and Savini Zangrandi 2025, Fernández-Villaverde et al. 2025, Johnson et al. 2026).
Empirical research on the economic effects of the war has nevertheless concentrated mainly on Ukraine, where data can still be collected despite the destruction caused by the invasion. Constantinescu et al. (2022), for example, use nightlights and other high-frequency indicators to track regional economic activity, while Gorodnichenko and Sologoub (2026) use a survey experiment to study how information affects perceptions of corruption. Measuring local economic effects inside the aggressor country is harder because reliable local data are scarce and both information and statistics are tightly controlled.
In a new paper (Mikula and Sabatini 2026), we address this gap by asking whether verified strikes on Russian refineries leave a persistent and spatially concentrated economic footprint that can be observed from outside official Russian reporting.
Measuring the footprint
Nighttime lights are a well-established proxy for economic activity where conventional data are unavailable or unreliable (Henderson et al. 2012). Our analysis combines four sources that do not depend on Russian official economic reporting. We construct a manually verified record of refinery strikes from ACLED event descriptions; measure daily nighttime radiance using NASA’s quality-screened Black Marble product; use NASA FIRMS active-fire detections to identify thermal anomalies around recorded strike dates; and draw on ERA5-Land weather data for the higher-frequency analysis.
The sample covers 29 large Russian refineries from June 2022 to May 2026. Twenty-two sustain at least one verified direct hit. We measure radiance in concentric areas around each refinery, excluding the innermost 500 metres, where the facility’s own lighting, gas flaring, and the immediate glow from fires are most likely to dominate the signal.
Our first design uses monthly data to compare refineries after their first verified strike with refineries that have not yet been struck or remain unstruck throughout the sample. This comparison traces what happens after a refinery enters the strike campaign. Subsequent attacks are part of the post-strike exposure, which is appropriate for a campaign characterised by repeated damage, repair, and renewed attack rather than by isolated one-off events.
Main results
Nighttime radiance falls immediately after the first verified strike and remains below its pre-strike trajectory throughout the period we observe. Within five kilometres of the refinery, the decline is about 15–18%. In the nearest measured ring, between 0.5 and one kilometre from the refinery centroid, it is roughly 30%.
The spatial pattern is central to the interpretation. The decline is largest close to the refinery and becomes progressively smaller as distance increases, with little evidence of an effect at 25 kilometres. This gradient is more consistent with disruption in the refinery and its surrounding industrial perimeter than with a broad regional downturn.
The contraction is also persistent. For refineries struck early enough to be followed for more than a year, the decline remains large beyond the thirteenth month after the first strike. This persistence may reflect slow repairs, especially where sanctions and wartime logistics restrict access to specialised equipment and services. It may also reflect repeated strikes on facilities that have already entered the campaign. Our design cannot identify what would happen if attacks stopped altogether. It shows that, over the course of the campaign, affected industrial areas do not return to their previous radiance path within the horizons we can observe.
Figure 1 shows that the estimated decline is largest in the smallest cumulative buffer and becomes progressively smaller as the measurement area expands. Since the larger buffers also include the areas closest to the refinery, this pattern indicates that the contraction is concentrated near the facility rather than uniformly spread across the full radius.
Figure 1 Aggregate post-strike change in nighttime radiance by distance from the refinery
The refinery effect is not a generic footprint of Ukrainian drone activity inside Russia. Applying the same satellite product and empirical specification to 106 other deep-strike targets, including military sites, fuel depots, other industrial plants, power infrastructure, and transport nodes, produces no comparable persistent decline.
To provide an order of magnitude, standard elasticities from the nightlights literature imply a local activity shortfall of about 5–6% within five kilometres and roughly 11% in the nearest measured ring. These are not estimates of local GDP, refinery output, or repair costs. They are scale benchmarks indicating that the disruption is economically meaningful.
Fire first, damage later
Nightlights create a conflict-specific measurement problem. A successful strike may initially make an area brighter because of fires and emergency response, even if ordinary productive activity later falls. A monthly average can reveal persistence, but it cannot by itself reconstruct this physical sequence.
Our second design therefore operates at the daily frequency and exploits variation in wind direction. Wind affects the range, ground speed, flight time, and energy requirements of fixed-wing drones. We do not observe launch sites or actual flight paths. Instead, for each refinery, we define a fixed direction from Ukraine towards the target and measure whether the daily wind is aligned with or opposed to that direction.
When winds are more closely aligned with movement from Ukraine towards a refinery, strikes become more likely; when winds are opposed, strike incidence falls. This day-to-day variation allows us to trace radiance around strike-favourable conditions among refineries already exposed to the campaign.
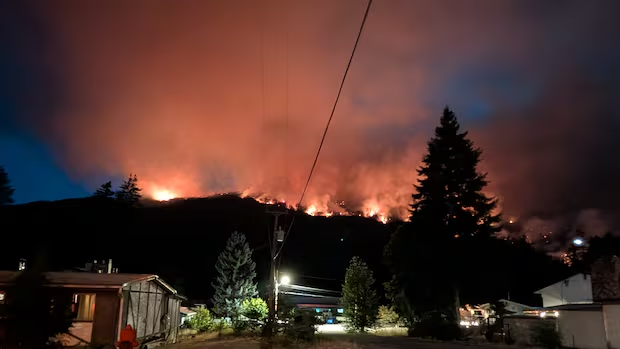
The resulting pattern is ‘fire first, damage later’. Radiance rises at short horizons, consistent with combustion and emergency activity, but turns negative around six months later. NASA FIRMS data provide a separate timing check: active-fire anomalies increase sharply around recorded strike dates. The combination helps distinguish the immediate thermal signature of an attack from the subsequent loss of ordinary nighttime illumination.
Weather-based instruments require caution because weather can also affect satellite measurement. Two features reduce this concern. First, the fire interpretation at short horizons is corroborated by an entirely separate satellite product. Second, the negative response is measured months after the wind conditions that shifted strike probability, when a contemporaneous effect of wind on image quality is much less plausible. We therefore interpret the daily results together with, rather than in place of, the monthly evidence and the spatial gradient.
Figure 2 shows the higher-frequency sequence: radiance initially rises around strike-favourable days and turns negative at longer horizons.
Figure 2 Radiance around strike-favourable wind conditions: fire first, damage later
Implications
The implications extend beyond the specific refinery campaign. Large refining facilities are not isolated production units. They are nodes in local industrial economies, connected to storage, transport, maintenance, security, and supplier activity. Disrupting them can therefore generate persistent effects beyond the physical boundary of the plant.
Long-range strike systems have also changed the geography of industrial vulnerability. Productive infrastructure can now be attacked far from the front line at comparatively low cost, forcing governments and firms to devote resources to protection, repair, substitution, and redundancy.
Our results do not establish the aggregate economic or strategic effectiveness of Ukraine’s campaign. Russia may compensate by reallocating production, using inventories, increasing imports, or shifting activity to undamaged plants. What the evidence does show is that strikes on fixed industrial assets can generate economically meaningful and persistent local losses. It also shows that these losses can be measured when conventional data are unavailable, delayed, or difficult to verify independently.
References
Cocozza, E and M Savini Zangrandi (2025), “Russia’s missing payments”, VoxEU.org, 20 April.
Constantinescu, M, K Kappner and N Szumilo (2022), “Estimating the short-term impact of war on economic activity in Ukraine”, VoxEU.org, 21 June.
Fernández-Villaverde, J, Y Li, L Xu and F Zanetti (2025), “Charting the uncharted: The (un)intended consequences of oil sanctions and dark shipping”, VoxEU.org, 11 March.
Gorodnichenko, Y and I Sologoub (2026), “The word is not enough: Testing the effects of information treatments on perceived corruption in Ukraine”, VoxEU.org, 28 May.
Henderson, J V, A Storeygard and D N Weil (2012), “Measuring economic growth from outer space”, American Economic Review 102(2): 994–1028.
Johnson, S, L Rachel and C Wolfram (2026), “How sanctions can help stabilise global oil supply”, VoxEU.org, 28 February.
Martínez, L R (2022), “How much should we trust the dictator’s GDP growth estimates?”, Journal of Political Economy 130(10): 2731–2769.
Mikula, Š and F Sabatini (2026), “The cost of industrial destruction: Evidence from Ukrainian strikes on Russian refineries”, IZA Discussion Paper 18772.