
 dailynewsnblog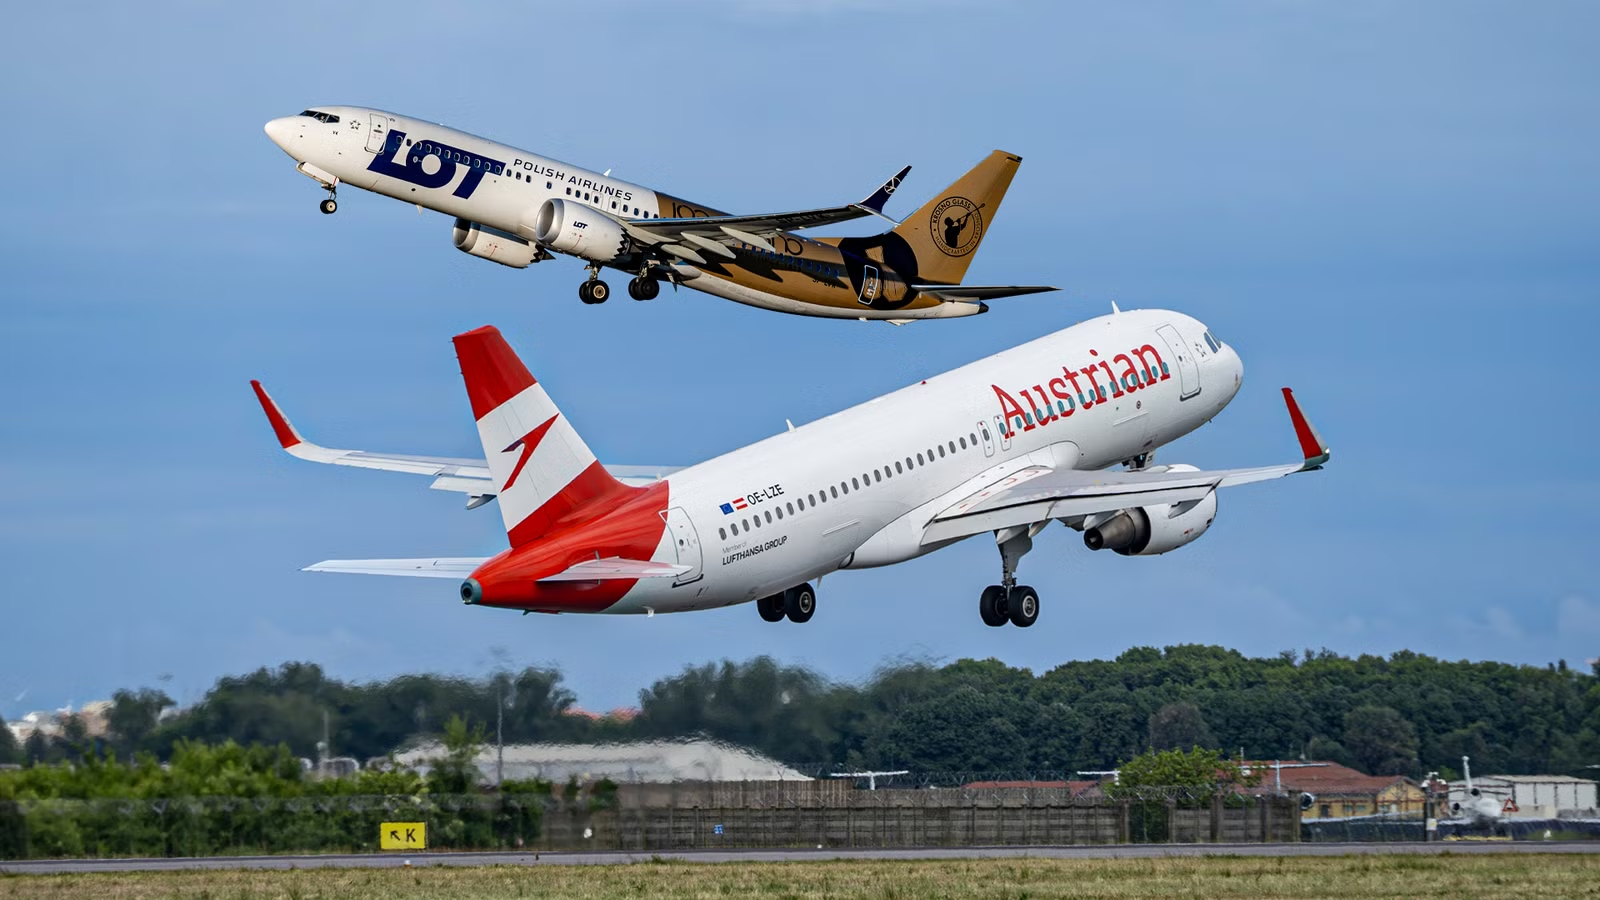
Selecting a narrowbody fleet to carry an airline through its plans tends to always end up focusing on fractional cost extraction. Airlines routinely analyze operational data points down to thousandths of a cent to determine whether the Boeing 737 or the Airbus A320 family yields the most favorable bottom-line performance. Marketing materials claim clear structural supremacy, but real-world line operations demonstrate an incredibly balanced competitive environment.
Single-aisle aircraft form the absolute backbone of global airline networks, capturing the vast majority of global passenger volumes and generating steady cash flows across short-haul corridors. These fleets fly multiple sectors per day with brief turnaround windows, so even a minute variance in per-seat operating efficiency can fundamentally alter corporate profitability over a standard 20-year asset life cycle. Network planners cannot afford to evaluate these platforms purely on standalone performance; instead, they must dissect how specific seating densities and fluctuating asset values interact within their unique route structures.
Keeping An Eye On Performance

To accurately evaluate the true commercial footprint of single-aisle operations, airline finance divisions rely heavily on cost per available seat mile (CASM) as their primary analytical baseline. This critical operating metric outlines the total expenditure incurred to fly a single passenger seat over a distance of one nautical mile (1.85 km). Airlines generally use this metric to reduce massive expenditures like fuel, crew salaries, and insurance fees into a singular unit, allowing executive boards to directly measure how efficiently an airframe generates capacity.
When applied to high-frequency networks, CASM acts as a brutal equalizer that cuts through manufacturer hyperbole and highlights real-world operational efficiency. A minor deviation in line efficiency, such as a localized route delay or an alternate high-altitude cruise routing, directly impacts the per-seat cost structure of a high-frequency daily schedule. For example, a carrier operating ten daily round-trips will witness substantial variations in seat-mile costs if one airframe features a slightly heavier empty weight or a layout that limits total passenger capacity. Consequently, network planners need to design their cabin configurations specifically to suppress this decimal-point volatility and keep the chosen narrowbody operating consistently within its optimal cost window.
Managing this unit cost equation requires corporate planners to balance highly variable expenses against structural ownership costs. While direct operating variables like fuel and block-hour maintenance scale continuously with every hour the aircraft is aloft, fixed ownership costs, such as lease payments and debt service, remain constant in absolute terms. Consequently, the capital cost component of CASM drops dramatically as an airline increases daily aircraft utilization, spreading those fixed obligations across a greater volume of seat miles.
Never Believe The List Price

Evaluating the capital component of the unit economic equation shows a financial disconnect between public manufacturer catalog prices and private market transactions. Original equipment manufacturers routinely publish inflated list prices that serve as baseline negotiation markers rather than actual transaction values. For an airline finance department, the critical metric is never the theoretical list price, but rather the actual capital layout required to place the asset on the corporate balance sheet.
 Boeing carries a higher list price for its 737 MAX 8, positioning the aircraft at approximately $117 million compared to the $110.6 million catalog price of the Airbus A320neo. However, real-world market values completely invert this relationship, with a nearly new Airbus A320neo commanding a market value near $58 million, while a comparable 737 MAX 8 trades closer to $52 million. This variance provides the American airframe with a lower baseline capital cost per seat, giving budget carriers a distinct advantage when financing large-scale fleet renewals.
The capital cost delta exerts an immediate impact on an airline balance sheet, particularly during periods of economic volatility or reduced network utilization. Because the monthly lease or debt obligation on a 737 MAX 8 is structurally lower, an airline can park the aircraft or reduce daily block hours with less fiscal strain than a carrier bound to higher Airbus lease rates. The capital buffer allows operators to absorb industry declines more effectively, protecting cash reserves when passenger load factors drop below optimal thresholds. For carriers focused heavily on minimizing fixed asset outlays, the lower market value of the Boeing platform offers a powerful economic shield, which, for many startups, is especially useful.
Fractional But Critical

The American airframe captures a distinct advantage in capital asset pricing, but the operational equation shifts back toward the European consortium when evaluating thermodynamic fuel burn. Fuel consumption represents the single largest variable expense for any mainline carrier, frequently accounting for more than 30% of total direct operating costs. To offset this exposure, both manufacturers introduced next-generation powerplants featuring ultra-high bypass ratios designed to squeeze maximum energy from every drop of jet fuel.
When comparing the two platforms under identical flight conditions, the Airbus A320neo demonstrates a fractional but highly consistent edge in per-seat fuel efficiency. The European narrowbody burns approximately 0.594 US gallons per 62 miles (2.25 liters per 100 km) per seat, whereas the 737 MAX 8 consumes roughly 0.602 US gallons per 62 miles (2.28 liters per 100 km) per seat. Translated into standard aviation metrics, this allows the A320neo to achieve an efficiency rating of 0.682 nautical miles per gallon (0.334 km per liter) per seat, marginally outperforming the 0.676 nautical miles per gallon (0.331 km per liter) generated by the Boeing platform.
These minute fractional deltas may appear inconsequential over a single flight segment, but they compound into massive financial expenditure variations across a mainline fleet operation. Over a standard annual schedule encompassing 3,000 block hours per airframe, this minor fuel advantage saves an operator tens of thousands of gallons of fuel per hull. For any major carrier managing a sub-fleet of one hundred aircraft, this efficiency gap translates directly into millions of dollars in annual savings. Numbers like these help explain why the Airbus platform remains highly favored by legacy network carriers operating long stage-length routes where fuel optimization dominates the CASM calculation.
Which One Fits The Most Passengers?

The cross-section of a narrowbody fuselage dictates far more than passenger shoulder room; it directly establishes the maximum physical threshold for cabin seat density and unit revenue generation. Engine thermodynamic efficiency is all well and good as it sets the baseline for operational fuel burn, but it is the interior seating geometry that dictates how effectively an airline can dilute those fixed operational costs. Connecting cabin floor space and certified emergency exit limits directly to seat-mile economics reveals why fuselage layout is a critical variable in the overall unit cost equation.
Under high-density single-class configurations typically seen with ultra-low-cost operators, the 737 MAX 8 can accommodate up to 210 seats, whereas the A320neo is capped at 194 seats due to door exit limit regulations. Spreading identical fixed flight deck expenses and navigation fees across 11 additional revenue passenger seats lowers the baseline unit cost per seat-mile, allowing budget carriers to achieve lower ticket price floors.
To fit 210 seats inside the 737 MAX 8 fuselage, airlines must reduce seat pitch down to 28 inches (71 cm) and install slimline lavatory modules near the rear pressure bulkhead. Conversely, while the A320neo carries fewer maximum seats, its wider cabin interior measuring 12 feet, 1 inch (3.70 meters) across allows for wider 18-inch (46-cm) seats and slightly faster boarding aisle flows. For low-cost airlines operating high-frequency leisure routes, the mathematical benefit of squeezing 11 extra seats onto every flight segment easily outweighs the slight loss in passenger pitch.
Adding The Stretch

Moving to stretched variants like the Airbus A321neo, with its LR and XLR subvariants, and the Boeing 737 MAX 9 naturally changes the per-seat cost reality, but both are still highly prized assets for efficiency. As network carriers seek higher passenger throughput on slot-constrained trunk routes, evaluating the unit economics of these larger single-aisle platforms becomes essential. The core A320neo and 737 MAX 8 trade fractional victories in capital and fuel metrics, but scaling the airframes upward alters the competitive balance significantly.
Catch what other flight trackers miss
Emergency squawks, holds, NOTAMs — live signals, no signup.
Open tracker
Catch what other flight trackers miss
Emergency squawks, holds, NOTAMs — live signals, no signup.
Open tracker
Breaking down the operational data across these stretched platforms shows that the competitive gap widens decisively in favor of the European airframe. The larger A321neo captures a definitive 3.5% to 4% cost per available seat mile advantage over the competing MAX 9. This widening economic gap stems from the A321neo’s superior payload-range capability and its Airbus Cabin-Flex door arrangement, which allows high-density configurations to carry up to 244 passengers compared to the 220-seat limit on the MAX 9.
Operators in mature markets like Japan and domestic US transcontinental corridors routinely deploy the A321neo as a high-efficiency replacement for aging Boeing 757 fleets and smaller widebodies. The ability to carry nearly 250 passengers at a fraction of the trip costs enables airlines to maximize revenue yields on heavily congested airport pairs. Consequently, on the stretched end of the narrowbody spectrum, Airbus holds a clear economic advantage that Boeing cannot match with the current abilities of the MAX 9.
All Depends On The Airline

Evaluating the broader fleet ecosystem shows exactly why single-airframe performance statistics rarely tell the full story of airline profitability. A purely theoretical comparison of fuel burn or list price ignores the immense financial impact of operational fleet commonality. For an established airline, integrating a new aircraft family requires huge capital outlays for pilot cross-crew qualification, specialized maintenance tooling, and split spare parts inventories, long before any of these supposed economical breakthroughs can occur.
For example, an operator managing an established fleet of one hundred 737 aircraft saves millions of dollars annually through unified flight crew scheduling and single-type maintenance pooling. Introducing a sub-fleet of A320neo aircraft to capture a 1% gain in fuel efficiency would immediately introduce millions of dollars in duplicate fixed overhead costs. Transitioning flight crews, line engineers, and ground handling infrastructure destroys short-term operational margins, completely negating any theoretical per-seat fuel savings gained in flight.
Ultimately, an airline configuration, route stage length, and existing fleet architecture matter far more than the standalone engineering deltas between the two manufacturing giants. While the Airbus A320neo family secures a modest edge in fuel efficiency and stretched-variant unit economics, the Boeing 737 MAX family responds with lower real-world market values and higher maximum seating density on its core variant. In the end the overall cost per available seat mile remains so closely matched, but the true economic winner is almost always decided by the network planners optimizing schedules in the headquarters, rather than the original equipment manufacturers in the factory.