United Airlines has more long-haul flights than any other airline worldwide. According to the carrier’s schedule submission to Cirium Diio, it plans an average of 148 daily long-haul departures in the first half of the year (double for both ways). Such activity has jumped by a reasonable 4% year-over-year.
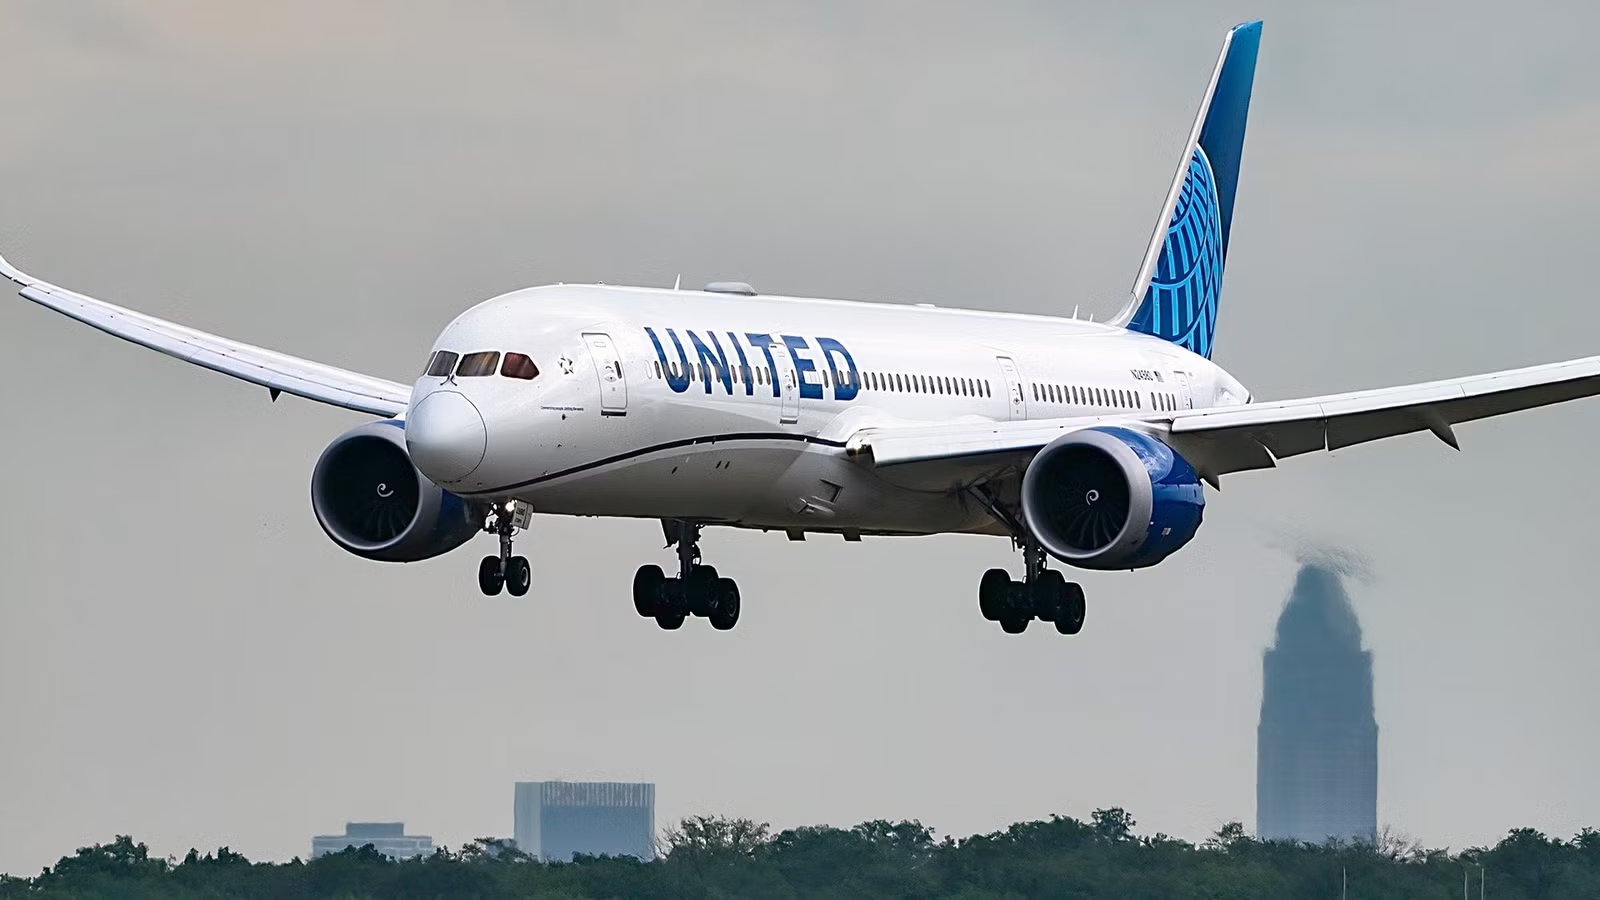
United is the largest US operator to Asia, Australasia, Europe, and the Middle East. It ranks second to Africa (behind Delta) and lower South America (behind American). Yet, the ![]() Star Alliance member’s sheer size means that long-haul activity only accounts for 6% of its total services.
Star Alliance member’s sheer size means that long-haul activity only accounts for 6% of its total services.
United’s Ten Longest Flights

They are shown below. They’re based on analyzing all the carrier’s flights scheduled for the first half of the year (January-June). As usual, the order is based on the maximum block time, which is measured as chocks-off-to-chocks-on. It is what is shown in airline booking engines, other booking places, in schedules, etc.
United’s longest route is timed at up to 17h 40m. It is from its Pacific hub of  San Francisco to
  Singapore. It is a Star Alliance route between two Star hubs, and is covered in more detail later in the article. It is 45 minutes longer than Delta’s longest airport pair.
|
Max. Block Time* |
Direction Of Route With That Time |
United’s Offering: January-June** |
|---|---|---|
|
17h 40m |
San Francisco to Singapore |
Two daily 787-9 |
|
17h 35m |
Houston Intercontinental to Sydney |
Daily 787-9 (seasonal) |
|
17h 10m |
Delhi back to Newark |
Daily 787-9 |
|
16h 20m |
Johannesburg back to Newark |
Six weekly to daily 787-9 |
|
16h 10m |
Cape Town back to Washington Dulles |
Three to four weekly 787-9 |
|
16h 05m |
Los Angeles to Hong Kong |
Two daily 787-9. One daily flight now continues to Bangkok, while the other continues to Ho Chi Minh City |
|
15h 55m |
San Francisco to Adelaide |
Brand-new route. Three weekly 787-9 (seasonal) |
|
15h 55m |
Los Angeles to Melbourne |
Three weekly to daily 787 |
|
15h 55m |
San Francisco to Melbourne |
Daily 787-9 |
|
15h 40m |
San Francisco to Hong Kong |
Two daily 777-300ER |
|
* Even if just once |
** It may differ at other times |
United’s Longest Route: San Francisco To Singapore

The carrier has operated from San Francisco to Chiang for years. One-stop services via Hong Kong existed until October 2004, before switching to flying via United’s now-resurgent Tokyo Narita hub. In most cases, the 747-400 was deployed, although the 777-200ER appeared too. One-stop San Francisco-Singapore flights ended in 2006.
United did not return to Changi until 2015, when it flew via Narita. But that one-stop operation did not last long. Things changed dramatically in 2016, when the carrier inaugurated its first nonstop flights from San Francisco to Singapore. For most of the time, the 787-9 ran daily. However, frequencies doubled in 2022, influenced, in part, by the end of its Los Angeles-Changi service in 2018.
San Francisco is the largest local market from the US to Singapore. According to booking data for the 12 months to October 2025, the very long market had 206,000 round-trip local passengers (all airlines combined). Los Angeles was second (160,000). San Francisco’s premium demand is substantial, with the average fare being a staggering $1,970 one-way (across all airlines, passengers, and cabins). United coexists with Singapore Airlines, which also runs twice daily (A350-900).

Revealed: Where Air France Flies Its Very High-Capacity 472-Seat Boeing 777s
Explore the deployment of Air France’s high-capacity 472-seat 777s.
United’s San Francisco-Singapore Load Factor Was 78%

US Department of Transportation data for November 2024 to October 2025 shows that United carried 292,000 round-trip passengers between San Francisco and Singapore. This includes everyone: those who connected to another flight in San Francisco (approximately 61%), local passengers (24%), those who transited at both hubs (11%), and those who transferred in Changi (4%). It was United’s fourth most-trafficked Asian market from its Northern California hub, behind Hong Kong (370,000), Taipei (350,000), and Seoul (311,000).
The same source shows that it filled 78% of the available seats. It did much better than this short international link. Singapore was its fourth-best Asian result from San Francisco, behind Hong Kong (76%), Beijing (76%), and Taipei (77%). Yet, it was two points lower than its average San Francisco-Asia result. Of course, it would have been balanced by high fares and yields.