
 dailynewsnblog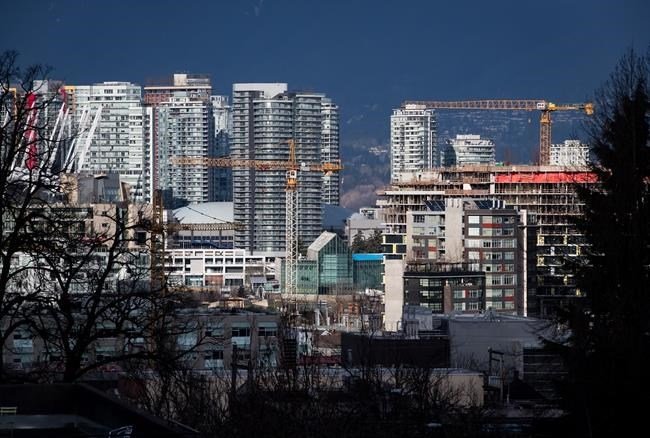

Weak presales, excess inventory and a slowing construction pipeline point to softer activity ahead in B.C.
Housing starts in B.C. jumped in August, but the increase does not indicate strength in the construction cycle as new projects remain paused due to poor market conditions, excess inventory and saturated rental markets.
Urban B.C. housing starts rose by 39 per cent to a seasonally adjusted annualized rate of 39,715 units, following three consecutive monthly declines. The increase was driven by a 44.6 per cent jump in multi-family starts, while single-family starts declined 1.7 per cent.
However, housing starts fluctuate from month-to-month, and the six-month moving average remained subdued. On a year-over-year basis, housing starts in urban centres fell 7.6 per cent and were down 9.7 per cent year-to-date. Both multi-family and single-family starts declined at a comparable pace during the first eight months of the year.
Within multi-family housing, the year-to-date decline was driven by a 13.6 per cent decrease in apartment starts, which account for most new housing construction in the province. In contrast, semi-detached and row housing starts increased 30.4 per cent and 0.8 per cent, respectively.
Among B.C.’s major urban markets, year-to-date, starts declined in Abbotsford-Mission (-47.7 per cent), Kelowna (-35.5 per cent), Vancouver (-6 per cent), and Victoria (-40.8 per cent). In contrast, starts increased by 41.7 per cent in Chilliwack and by 70.3 per cent in Nanaimo, while starts in Kamloops more than doubled compared with the same period last year.
Despite weaker starts, more than 84,000 units remain under construction across B.C., primarily apartments in Vancouver, reflecting earlier construction decisions and long project completion timelines. Low pre-sale sell-through and weak residential building permit activity signal slower construction ahead, raising concerns about future housing supply and affordability.
On the employment front, business-reported payroll counts in B.C. were essentially unchanged in July, edging down by 514 positions, or less than 0.1 per cent, to approximately 2.59 million. This followed a similarly modest decline of 329 positions in June. Payroll employment remained 0.7 per cent, or 19,962 positions, above its year-earlier level. Nevertheless, the recent monthly weakness points to subdued employment growth.
Excluding unclassified businesses, payroll employment declined by 1,304 positions. This measure provides the basis for the industry breakdown below. By comparison, the Labour Force Survey reported a monthly employment increase of 17,800 in July, although the two surveys measure employment differently.
Goods-producing industries lost 554 payroll positions in July, leaving employment 0.6 per cent, or 2,124 positions, below its year-earlier level at approximately 388,990.
Manufacturing posted the largest monthly decline, shedding 754 positions, and was down 1,213 positions from a year earlier. Construction employment fell by 568 positions during the month and by 436 year-over- year. In contrast, utilities added 554 positions in July and 1,090 positions over the previous 12 months.
Service-producing payroll employment declined by 750 positions in July but remained 1.3 per cent, or 29,118 positions, above its year-earlier level.
Accommodation and food services led the monthly gains, adding 870 positions and recording a fourth consecutive increase. Administrative and support, waste management and remediation services added 660 positions, reversing the previous month’s decline. Educational services recorded the largest monthly decrease, losing 803 positions, while health care and social assistance declined by 800 positions. Despite these monthly declines, health care and social assistance posted the largest year-over-year gain, at 10,376 positions, followed by educational services at 7,486 positions.
Average weekly earnings rose 0.6 per cent in July and by 4.5 per cent from a year earlier, reaching $1,356.78. The increase was robust but partly reflected the composition of hiring. The job vacancy rate remained at 3.1 per cent for a third consecutive month, corresponding to approximately 79,585 vacant positions.
Bryan Yu is chief economist at Central 1.