 dailynewsnblog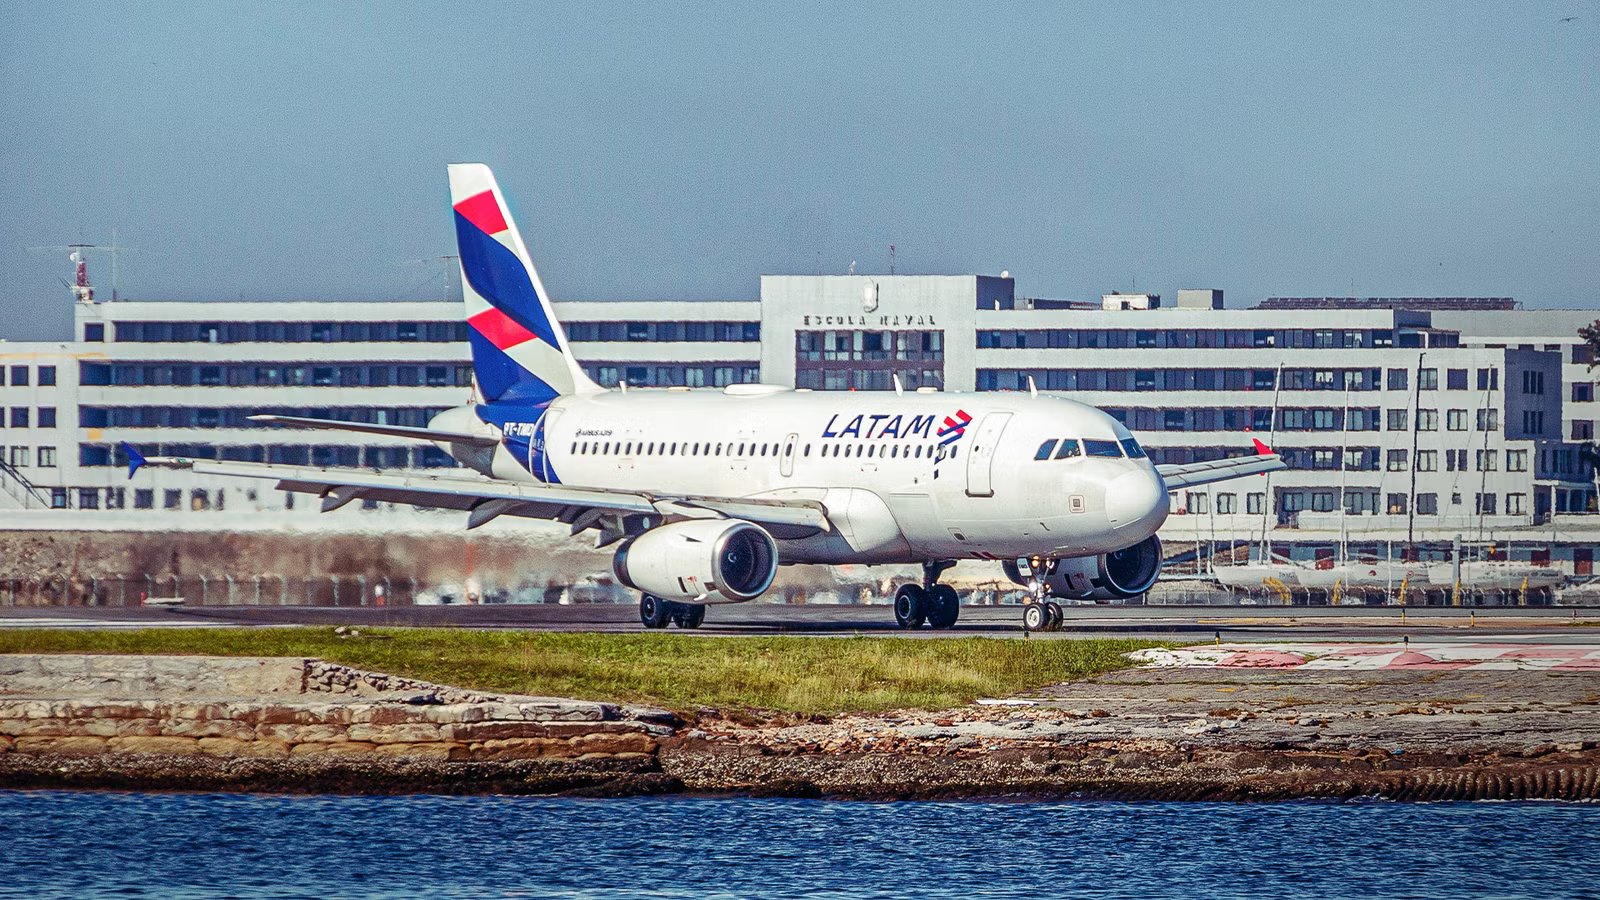
In 2025, airlines worldwide reported an estimated 7.2% average operating profit margin, according to the International Air Transport Association (IATA). While Latin America as a whole performed slightly above this average with a 14.0% operating margin. While the region’s net margin was only 3.8% overall, the largest carriers achieved margins far exceeding this number. The region’s largest airline, LATAM Airlines Group, reported an 11.2% adjusted net margin last year, while Panama’s Copa Airlines achieved an impressive 18.6% net margin.
At first glance, these results appear surprising for a region where five major airlines have entered Chapter 11 since 2020. However, the restructurings, consolidation, capacity discipline, and unique geography of Latin America have created a significantly different competitive environment. This raises the question of whether Latin American carriers are genuinely outperforming their US and European counterparts.
Why Did Latin American Airlines Struggle?

Since 2020, several prominent Latin American carriers have filed for Chapter 11 bankruptcy protection. These include Aeromexico, Avianca, LATAM Airlines, GOL Linhas Aéreas Inteligentes, and, more recently, Azul Linhas Aéreas Brasileiras. Although all five airlines successfully restructured and continue flying today, several smaller carriers have disappeared completely, including Viva Air in Colombia and Peru and Mexico’s Interjet.
Important reasons for the challenging market environment airlines from Latin America face include the general economic and political instability of the region, combined with currency volatility and fierce competition from US and European airlines. Governments across the region often impose high taxes on aviation, and regulation is often not standardized across borders.
Currency exposure is particularly important, considering that many of a carrier’s largest expenses, such as aircraft leases, maintenance, spare parts, and fuel, are priced in US dollars. A sharp depreciation of a local currency can therefore increase costs considerably, while high inflation simultaneously weakens consumers’ purchasing power.
This is in addition to the competitive pressure from foreign carriers such as  American Airlines and
  Iberia on long-haul routes, and periods of aggressive capacity growth and fare competition in large domestic markets such as Brazil, Colombia, and Mexico.
Moreover, underinvestment in airport and air traffic management infrastructure has caused several of the region’s primary hubs to become heavily congested as demand has outpaced infrastructure growth. El Dorado International Airport (BOG) in Bogotá and Benito Juárez International Airport (MEX) in Mexico City both face severe capacity constraints. Lima’s new terminal demonstrates the scale of the infrastructure investments required elsewhere in the region to accommodate continued growth.
How Does Latin America’s Geography Create Both Complexity And Opportunity?

Latin America’s geography, especially in South America, adds another layer of operational complexity. Several of the region’s most important hubs are located at high elevations, where conditions can produce a “hot-and-high” performance penalty for aircraft, particularly when high elevation is combined with warm temperatures.
Bogotá’s El Dorado International Airport sits approximately 8,360 feet (2,548 meters) above sea level, while Mexico City International Airport is located at around 7,316 feet (2,230 meters). Moreover, the Amazon rainforest and the Andes mountain range cover a large part of the continent, creating challenging weather conditions and forcing aircraft to operate across difficult terrain.
On the other hand, this geography also strengthens the air travel market. Both the Andes and the Amazon make it difficult to build large and efficient interconnected highway and railway systems, especially across borders, making air travel an essential form of transportation.
As a result, some cities and regions are so isolated that they are almost entirely dependent on aviation. The Brazilian city of Manaus, located in the middle of the Amazon rainforest and home to over two million residents, is a prime example. This geographical isolation, in combination with more than 80% of the region’s population living in urban centers, creates a number of highly concentrated international and domestic trunk routes, helping support yields.
In many domestic markets, journeys of 20 to 30 hours by bus remain common. However, rising incomes and the expansion of low-cost carriers have made it increasingly possible for passengers to replace these long bus journeys with relatively short flights. This means airlines are not always competing for existing air passengers, but can stimulate completely new demand by making air travel more affordable.
How Did Most Latin American Airlines Go From Bankruptcy To Profitability?

Over the past few years, the largest Latin American airlines have all returned to profitability. Although the recovery was supported by strong post-pandemic demand, the Chapter 11 restructurings fundamentally changed the cost bases and balance sheets of the airlines involved.
During these processes, airlines were able to renegotiate aircraft leases, reduce debt, return inefficient aircraft, and restructure relationships with suppliers. This was particularly important because many carriers entered the pandemic with high leverage and large fixed financial obligations, while receiving significantly less government support than airlines in the United States and Europe.
Azul’s restructuring provides one of the most recent examples. The Brazilian airline emerged from Chapter 11 in February 2026 after reducing debt and lease obligations by approximately $2.5 billion. This does not automatically make the airline profitable, but it considerably reduces the amount of revenue needed to service debt and interest payments before anything reaches the bottom line.
The restructuring processes also allowed airlines to rethink their wider business models. Avianca increased the number of seats on its Airbus A320 family aircraft, simplified its onboard product, reduced its cost base, and expanded ancillary revenue, moving closer to a low-cost model. LATAM, meanwhile, retained a more traditional full-service model while using its scale, cargo division, loyalty program, premium demand, and extensive domestic networks to diversify revenue.
According to Peter Cerda, IATA’s Regional Vice President for the Americas:
“Previously, airlines were regularly adapting to governmental changes, few of which were aviation friendly. But following a mix of restructuring through Chapter 11 and consolidation, airlines are now better positioned and better structured than a decade ago. They are now competing on a global scale.”
Consolidation has also reduced some of the destructive competition that historically existed across the region. Avianca and GOL are now controlled by the same parent company, Abra Group, while weaker competitors such as Interjet and Viva Air have disappeared. Other carriers have become more disciplined about capacity growth after shareholders and creditors suffered significant losses during the pandemic.
Nevertheless, Chapter 11 alone does not explain the strong results. Airlines elsewhere in the world have also restructured without subsequently producing high margins. The difference is that the financial resets occurred at the same time as demand recovered, competitors disappeared, capacity became constrained, and carriers became more disciplined. Together, these factors created an unusually favorable revenue environment for the airlines that survived.
Are Latin American Airlines Actually Outperforming?

Compared to other regions’ overall profit margin, Latin America appears to outperform. IATA estimates that Latin American carriers produced an EBIT margin of 14.0% in 2025, compared with 6.7% for European carriers and 6.4% for North American carriers. On a net basis, Latin America achieved a 3.8% margin, compared with 4.8% in Europe and 3.5% in North America.
The region therefore comfortably outperformed its counterparts through its core airline operations. However, operating and net margins measure different types of profitability. An operating margin reflects how profitable an airline’s core activities are before interest and taxes, while a net margin also accounts for financing costs, taxes, currency movements, and exceptional items. These additional expenses meant Latin America only narrowly exceeded North America and fell behind Europe on a net basis.
IATA Estimated 2025 Profitability per Region | ||
|---|---|---|
Region | 2025 Estimated EBIT Margin | 2025 Estimated Net Margin |
Latin America | 14.0% | 3.8% |
Europe | 6.7% | 4.5% |
North America | 6.4% | 3.5% |
Global industry | 7.2% | 4.2% |
Source: IATA Global Outlook for Air Transport – June ’26 | ||
This distinction is particularly important in Latin America because airlines generally face higher financing costs, weaker balance sheets, and greater currency volatility. The large difference between the region’s 14.0% EBIT margin and its 3.8% net margin suggests that a significant share of operating profit is still being absorbed by non-operational expenses.
Did Latin American Carriers Also Outperform Major US and EU Airlines?

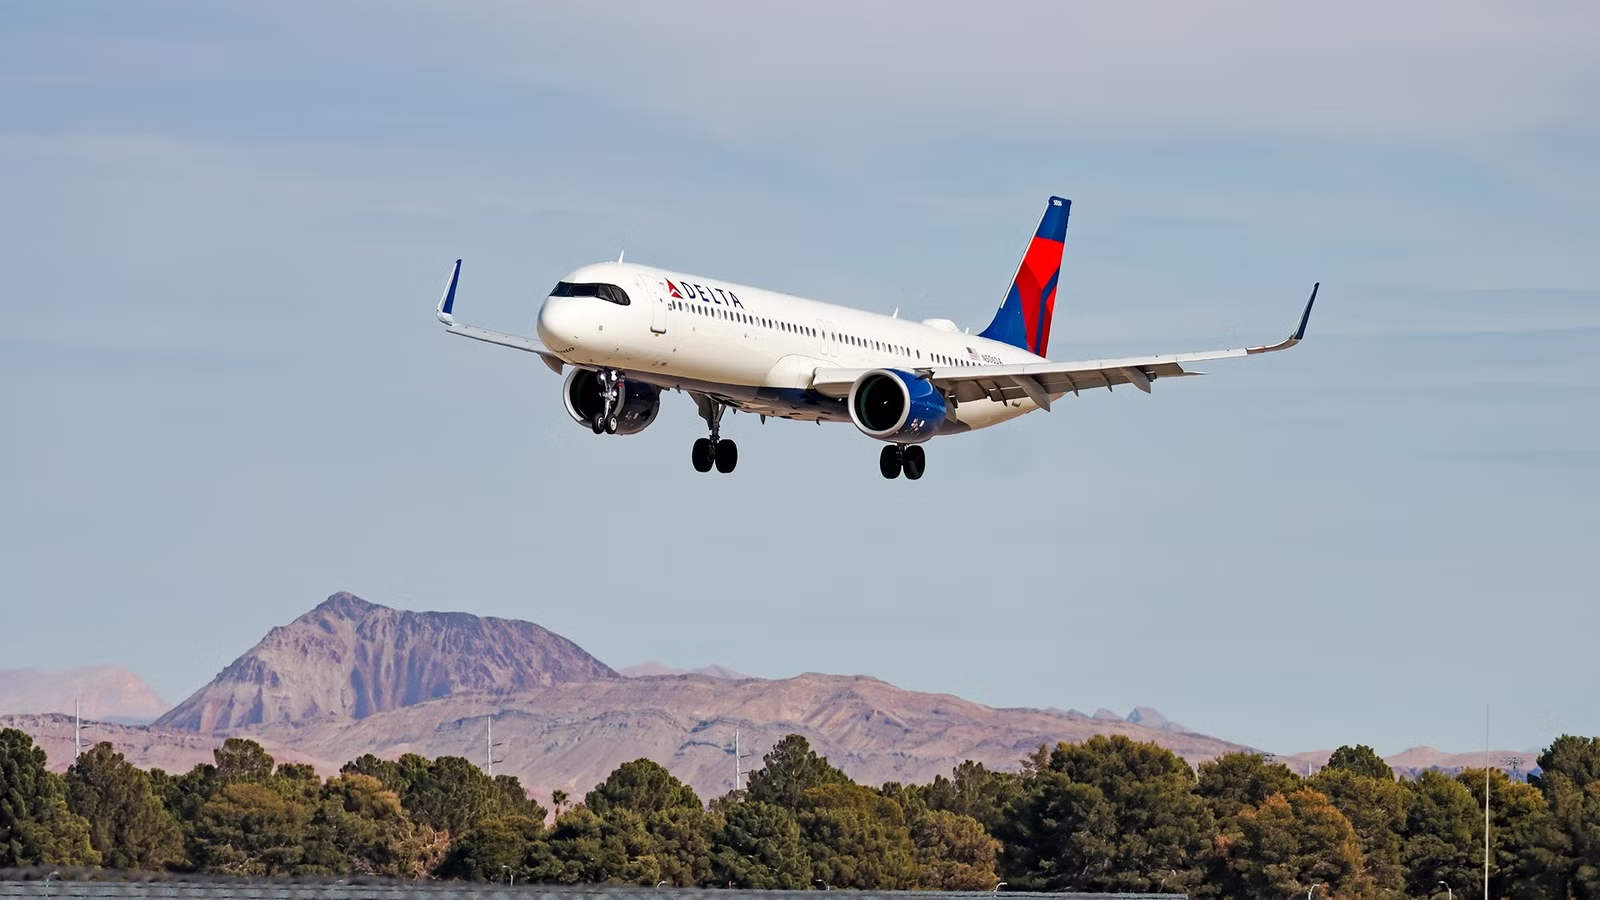
The largest and most successful carriers in Latin America also outperformed the largest carriers in the US, while delivering similar results as the most successful European airlines. LATAM Airlines Group outperformed major US network carriers such as Delta Air Lines and United Airlines on both operating and net margins, while achieving results broadly comparable with the strongest European airline groups.
Copa Holdings comfortably outperformed the most profitable US and European airlines. In 2025, Copa achieved a net profit of $671.6 million in 2025, equivalent to a net margin of 18.6%. This was more than four times the worldwide airline average and demonstrates that the region’s leading airlines can generate margins well above those of many larger global competitors.
FY2025 Airline Profitability Comparison | ||||
|---|---|---|---|---|
Company | Market | Operating Margin | Net Margin | Net Profit |
Copa Holdings | Latin America | 22.6% | 18.6% | $671.6 million |
LATAM Airlines Group | Latin America | 16.1% | 10.1% | $1.46 billion |
International Airlines Group | Europe | 15.1% | 10.1% | €3.34 billion |
Ryanair | Europe | 11.2% | 11.6% | €1.61 billion |
Delta Air Lines | United States | 9.2% | 7.9% | $5.01 billion |
United Airlines | United States | 8.0% | 5.7% | $3.35 billion |
Source(s): LATAM Airlines Group, Copa Holdings, IAG, Delta Air Lines, United Airlines, and Ryanair | ||||
Logically, higher margins do not necessarily translate into higher absolute profits. Delta still generated more than $5 billion in net income in 2025, over seven times Copa’s result, reflecting the significant scale advantages enjoyed by the largest US airlines. These include extensive loyalty programs, valuable corporate contracts, larger domestic markets, and stronger access to capital.
The comparison is also more mixed in Europe. International Airlines Group (IAG) achieved an operating margin of 15.1%, while Iberia individually reached 16.2%. Ryanair’s low-cost model also produced a net margin slightly above LATAM’s. Therefore, LATAM and Copa outperformed most of the large network airlines included in the comparison on efficiency, but not every leading European carrier.
Catch what other trackers miss
Emergency squawks, holds, NOTAMs — live signals, no signup.
Open tracker
Catch what other trackers miss
Emergency squawks, holds, NOTAMs — live signals, no signup.
Open tracker