While economists once dismissed biodiversity loss as a distant externality, it has now crystallised into a quantifiable financial risk. It is increasingly framed as a source of financial risk, with potential implications for credit quality, asset valuations, and financial stability (Dasgupta 2021, NGFS 2024). In the EU, this shift is now embedded in regulation: biodiversity features explicitly in the Corporate Sustainability Reporting Directive (CSRD), the Sustainable Finance Disclosure Regulation (SFDR), and the EU Taxonomy.
At the same time, policymakers are grappling with a practical problem. While reporting requirements are expanding, biodiversity risk assessment remains far less standardised than climate risk assessment. Unlike greenhouse gas emissions, biodiversity impacts depend strongly on where economic activity takes place. This creates high data demands for firms and financial institutions, raising concerns about proportionality and cost-effectiveness – concerns that feature prominently in recent debates around the Omnibus Regulation and the Draghi Report on EU competitiveness.
The question is therefore not whether biodiversity should be reported, but how it can be done credibly, consistently, and at scale.
Why location matters for biodiversity impacts
A defining feature of biodiversity risk is its spatial nature. Identical emissions can have very different ecological consequences depending on their proximity to sensitive ecosystems. In particular, freshwater biodiversity is highly exposed to nutrient loads and toxic releases when industrial facilities operate near protected areas with rivers, wetlands, and protected habitats.
This spatial aspect is poorly captured by most firm-level ESG indicators. Aggregated environmental scores typically ignore whether emissions occur next to a protected area or far from any vulnerable ecosystem. As a result, biodiversity risks can be significantly underestimated in both corporate reporting and assessments of financial portfolios.
Recent frameworks such as the Taskforce on Nature-related Financial Disclosures (TNFD) explicitly acknowledge the relevance of location. However, many proposed approaches rely on proprietary datasets or firm-reported information that is incomplete, confidential, or difficult to verify – making them hard to use for banks assessing thousands of counterparties.
Using pollution registers as a reporting backbone
An alternative approach is to start from what already exists. Pollutant release and transfer registers (PRTRs) were created to ensure transparency around industrial pollution. In Europe, the European PRTR (E-PRTR) provides harmonised, facility-level data on pollutant releases to air, water, and soil for thousands of industrial sites.
Although PRTRs were not designed for financial risk analysis, they have three major advantages for biodiversity reporting:
- They operate at facility level, not just at firm level (location is precisely recorded)
- They are harmonised across countries and sectors
- They are publicly available, keeping compliance costs low
What PRTRs lack is ecological context. Emissions alone do not determine biodiversity risk unless they interact with sensitive ecosystems. This is where spatial integration becomes critical.
Linking industrial pollution to Natura 2000 sites
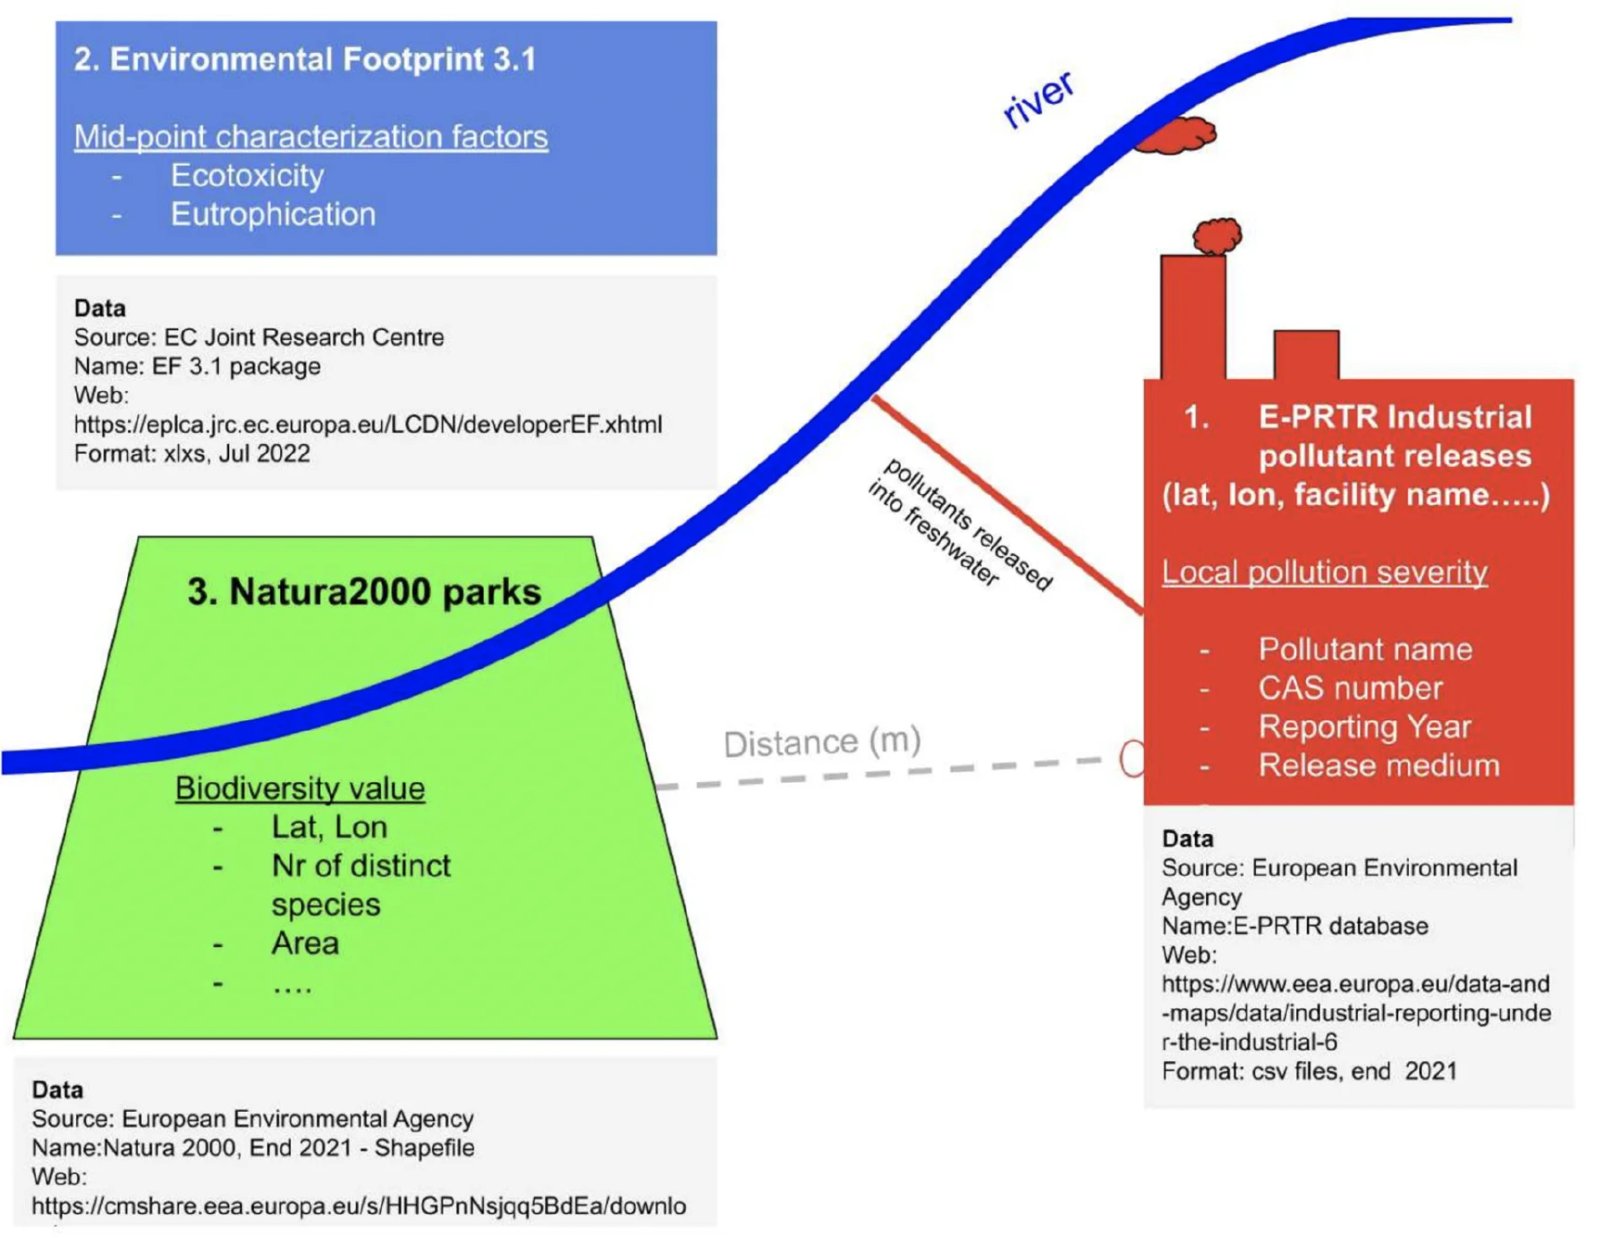
Our recent research links PRTR data with Natura 2000, the world’s largest network of protected areas, covering more than 18% of EU land territory (Erhart et al. 2025). Many Natura 2000 sites protect freshwater species that are particularly vulnerable to eutrophication and toxic pollution (Figure 1).
By combining facility-level emissions with geographic information on protected areas and updated characterisation factors from the Joint Research Centre Environmental Footprint database, we estimate freshwater biodiversity risk exposure at the level of individual Natura 2000 sites.
Figure 1 Simplified design of the applied research method

Source: Adapted from Erhart et al. (2025).
Two findings stand out.
- First, freshwater biodiversity risk is highly concentrated geographically.
Figure 1 in the underlying research maps pollution-induced freshwater biodiversity risks across Europe, revealing strong clustering in highly industrialised regions such as the Benelux countries, southern Germany, northern Italy, and south-west France. River basin districts such as the Danube, Elbe, and Ebro emerge as particularly exposed (Figure 3).
- Second, proximity amplifies risk sharply.
Figure 2 shows the overlaid maps of industrial facilities and the borders of Natura 2000 sites. Several hundred facilities are located within 500 metres of protected areas, 126 industrial facilities within 100 metres, and 51 inside protected boundaries. These facilities account for a disproportionate share of estimated freshwater biodiversity risk, even when their total emissions are not exceptionally large.
Figure 2 EPRTR facilities and Natura 2000 sites (where the distance is less than 500 m)

Source: Adapted from Erhart et al. (2025).
Impact calculations may need an approach similar to Scope 3 accounting
A further insight concerns sectoral composition (Figure 3). Biodiversity risk is often implicitly associated with heavy manufacturing or extractive industries. While these sectors matter, our results show that sewerage and wastewater treatment activities are among the largest contributors to freshwater eutrophication risk affecting protected areas. It should be added, however, that wastewater treatment service is a major input to other economic sectors’ production and therefore impact potentials are indirectly caused by the water treatment demand from companies in other sectors. In the same vein, the climate change impact of the electricity sector is dependent on activities in other industrial sectors (Erhart and Erhart 2023). Hence, the GHG emissions accounting approach could also be recommended for other environmental footprints, for example drawing a distinction of SCOPE1 direct emissions, SCOPE2–3 indirect emissions from indirect water treatment inputs and emissions from the value-chain, could be a policy option, especially because the layout of industrial facilities may not be changed substantially, meaning a lock-in of the proximity of the facilities to the Nautra 2000 sites.
Figure 3 Sectoral contributions to freshwater biodiversity risk
Share of total estimated biodiversity risk exposure attributed to major industrial sectors. Sewerage and wastewater treatment activities emerge as significant contributors alongside manufacturing.

Source: Adapted from Erhart et al. (2025).
Cross-border exposure and systemic relevance
Biodiversity risks do not respect national borders. In several river basins, pollutant releases from facilities in one country affect protected areas in another (Figure 4). Our estimates suggest that a non-negligible share of industrial sites reporting water emissions are closer to protected freshwater ecosystems abroad than to the nearest protected site in their own country.
From a financial perspective, this reinforces the case for basin-level and EU-wide assessments, rather than purely national approaches. For banks operating across borders, location-based biodiversity indicators provide a consistent way to identify exposures that may otherwise remain invisible in country-level reporting.
Figure 4 Spatial distribution of freshwater biodiversity risk exposure across Europe
Estimated biodiversity risk scores for Natura 2000 freshwater sites, aggregated by river basin district. Higher values indicate greater potential impacts from nearby industrial pollution.

Source: Adapted from Erhart et al. (2025).
Implications for banks and supervisors
For banks, biodiversity risk primarily enters through credit risk. Firms exposed to high biodiversity risks may face higher regulatory costs, operational constraints, litigation, or reputational damage, all of which can weaken their repayment capacity. Recent ECB research has already begun to integrate our method on pollution-related biodiversity risk calculation into bank-level analyses of euro area loan portfolios (ECB 2024).
Banks need screening tools, not bespoke ecological studies. The proximity-based pollution exposure approach provides exactly this: a first-pass indicator that highlights where biodiversity risks are likely to be material, using transparent and reproducible data.
Crucially, this approach does not depend on confidential firm disclosures. It relies on public registers, which improves verifiability and reduces compliance costs – an increasingly important consideration in the current regulatory climate.
Transparency gaps and confidentiality claims
One obstacle remains the occasional use of confidentiality claims in pollution reporting. In several cases, firms can withhold detailed emission information on commercial grounds. While such exemptions may be justified individually, their cumulative effect is to weaken biodiversity risk assessments precisely where accuracy matters most.
If biodiversity loss is recognised as a potential source of systemic financial risk, then environmental transparency itself becomes a prudential concern. Addressing data gaps in pollution registers may therefore be as important as developing new biodiversity metrics.
Simplification without dilution
Debates on simplifying EU sustainability reporting often risk conflating simplification with dilution. The evidence suggests that the opposite is possible. By prioritising existing, harmonised, and location-specific data sources, biodiversity reporting can become both more informative and less burdensome.
Pollution registers linked to protected area data do not capture every dimension of biodiversity loss. But they provide a robust, scalable baseline – one that can be refined over time and
Conclusion
Biodiversity risk reporting does not need to start from scratch. Public pollution registers and spatial data on protected ecosystems already offer a powerful foundation for cost-effective, decision-useful indicators. The evidence shows that proximity to sensitive ecosystems is a key driver of biodiversity risk – and one that financial institutions can no longer afford to ignore.
As biodiversity becomes firmly embedded in financial regulation, the focus should shift from inventing ever more complex metrics to using existing data more intelligently. In that sense, proximity still matters – and recognising this may be the most practical step towards credible biodiversity risk reporting for banks.
Authors’ note: At the time of the research, Andrea Hagyó worked at the European Environment Agency and Bálint Menyhert worked in the European Commission Joint Research Centre, Ispra.
References
Dasgupta, P (2021), The Economics of Biodiversity: The Dasgupta Review, HM Treasury.
ECB – European Central Bank (2024), “The climate–biodiversity–pollution nexus”, ECB Working Paper No. 3164.
Erhart, S, A Hagyó, B Menyhért, and K Erhart (2025), “Freshwater biodiversity risk exposure of Natura 2000 sites to industrial pollution”, Ecological Economics 226, 108073.
NGFS – Network for Greening the Financial System (2024), “Nature-related Financial Risks”.